

Tor Helge Hansen, CEO of Ceetron
Some days ago, we released Ceetron Report Component (CRC), a tool for ISVs who create end user software for the CAE community. CRC’s goal is simple; it lets end users create engineering reports directly in the formats of MS Word or MS PowerPoint. But the need for such a tool illuminates some interesting trends in CAE, all centered on the changing requirements for engineering reporting.
Reporting itself is not new; simulation engineers have always been required to document the results of their simulations. What is required of that “documentation,” however, has changed dramatically. It used to happen towards the end of a given project, written in terms understandable only to peers. Not any more. Engineers are now asked to communicate engineering information not only during the design process (clarification of the task, conceptual design, embodiment, and detail design), but rather through the entire project life-cycle (before, during, and after), and also to communicate it in degrees of detail, and in media, designed for audiences whose engineering skills run the gamut from the expert to the functionally innumerate. And ISO 9000 has come along, enforcing quality management procedures.
Hence our customers’ request for an advanced tool for reporting.
To make the requirements of what we might call The New Reporting perfectly clear, it is helpful to analyse the different aspects these reports already have.
One influential aspect is the report’s purpose. When I discussed this with one industry expert, he quickly laid out the main reasons such reports are written:
- Verification and validation of the simulation model;
- Comparisons with experimental results;
- Technical recommendations for a design or for issue resolution;
- Performance characterization, e.g., the expected lifetime of a technical part, or its impact on fuel efficiency;
- Compliance to various regulations (e.g. HSE) or recommended practices (e.g., DNVGL).
Another aspect is the report’s intended audience. Clearly, the format, media, language, and degree of detail must differ when an engineer writes for his simulation peers, vs. designers, vs. business management, vs. customer service/technical support, vs. marketing, and so on.
The same is true on yet another axis when the engineer wishes to write appropriately for the organizational level of his or her readers. A typical classification from a major car manufacturer shows how the organizational level of the audience can change a straightforward document saying “Here’s what we did” into:
- An informal memo (for engineering colleagues);
- A technical memo (for technical management);
- A technical staff memo (for senior management).
A final aspect is when the report is used in the product lifecycle. Some simulation reports are used early, at the stage when the design of a proposed product is still fluid, and the report can add the most value in making clear the issues and benefits associated with conceptual or high-level design directions. Other reports are used later, when large-scale decisions have already been made, and there is a premium on analysing and resolving detailed issues in a design or service.
The point is that all engineering reporting takes time, and hence they are often surprisingly late and still not of the desired quality. Before writing this blog post, I consulted with colleagues and with Jan Christian Anker, a long-standing member of the Norwegian CAE community and a former board member of Ceetron.* He summed up the timing issue beautifully when he said that still many products are “analysed as drawn, not drawn as analysed”, adding the somewhat inquisitional question: “What is the point in drawing up a product that you cannot document will work?” In other words, by the time the engineering analysis reporting for a given product is in a form where it could actually add some value, the product revision process may already be over.
This consultation helped me identify five key challenges in engineering reporting, which I will explore in some detail. It also allowed me and my colleagues to construct a reasonable scenario for what engineering reporting may look like in 2020.
Let’s move on to the five challenges:
Five Current Challenges in Engineering Reporting
Challenge 1: Lossy data extraction
A critical and time-consuming task is extracting information from the engineering applications and importing it into the report editing tool. Creating the required images, plots, tables and other engineering information takes a substantial amount of time and the copy-and-paste approach is a source of error.
Some engineers are forced to use a screen capture utility to transfer information from the engineering application to the editing tools. Unfortunately, this further aggravates the above problems. Such technique does not allow for taking advantage of the characteristics of the information – 2D or 3D, tabular information, images only, single numeric values, etc. If you need to draw quantitative information such as min or max values with corresponding nodal information from simulation models to a report, you may only find such information through painful filtering of comprehensive data exports.
In a better world: An integrated information capture function between the engineering application and the reporting tool would allow information to flow with as little human intervention as possible, increasing efficiency, eliminate data transfer errors, and improving the quality of the report.
Challenge 2: Complex, inefficient workflows
In comprehensive reports, the amount of information that needs to be transferred from the engineering application to the reporting tool is substantial. The combined use of built-in and external data collection mechanisms makes the workflow complex and fragmented. The captured information is stored in different formats and, occasionally, ends up in different locations: This is highly inefficient.
In a better world: A reporting tool should enable easy capture of the necessary information from various data sources through a single GUI, and a single storage for the extracted information that provide a full overview of all collected content for the report.
Challenge 3: Automated and interactive report generation using one tool
Reports from simulation projects come in very different formats, size and content. Some can be produced more or less automatically, while others require a lot of intervention by the engineer. The challenge is to be able to produce both automatic and interactively generated reports using one single tool.
As an example, consider an OEM company in the automotive industry that produces a specific part in various configurations / variants and needs to simulate and report the properties of each configuration to the customers. The accompanying documentation follows a detailed specification and the steps needed to produce them are highly repetitive for each configuration of the part. As a consequence, the report content could be drawn more or less automatically from a simulation database – if tools that support automation were available.
Now, consider the same company implementing new routines or equipment in their production line. Simulations would be required to test the properties of the parts following the new production process. Generation of reports from this project could not be generated automatically, but would require a substantial amount of user intervention when creating the report.
In a better world: A reporting tool should be able to handle any degree of automation/intervention: Fully automated, fully interactive, and anything in between.
Challenge 4: Crossing the chasm between the CFD and FEA simulation results extraction and formats used in industry standard report-writing tools
More than 90% of all simulation engineers are using MS Office to document and present their simulation projects. (The alternative today is Google Docs.)
The majority of engineering applications on the market has limited or no direct support for building reports using standard tools such as MS Office. The ideal situation for the simulation engineer would be to have a direct integration of their reporting tools with their engineering application. In the foreseeable future this is not a realistic scenario due to the complicated tasks of making a tight integration between a SPDM system or pre- or post-processor and MS Office.
In a better world: A loose coupling between the post-processor and MS Office may be a reasonable compromise in order to obtain efficiency, flexibility and ease of use.
Standard editing tools such as MS Office have functionality for setting up document templates. Report templates would typically contain a description of the work flow of the engineering process. This would ensure that all steps in the engineering process would be completed before the simulation report is finalized.
An additional benefit would be that the use of MS Office in an organization would automatically enforce the use of the accompanying document formats of these tools.
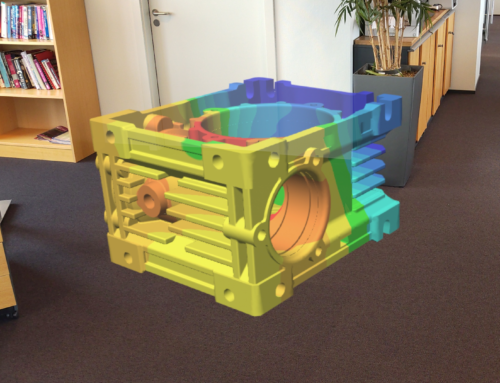
Challenge 5: Realizing the value of (visual information and) interactivity
Visual analysis is really the starting point for most practical engineering analysis, especially for V&V, detecting problem areas (e.g., stress concentrations), comparison with experimental data, and dynamic phenomena. This is particularly true for collaborative workflows.
Traditionally, a large number of images is used in reports to depict for example the analysis setup, and relevant result mappings at different time-steps and from different view angles. Producing such images and making sure that all relevant images are available is a time-consuming task and does not give the same support for ‘what if’ exploration as an interactive model.
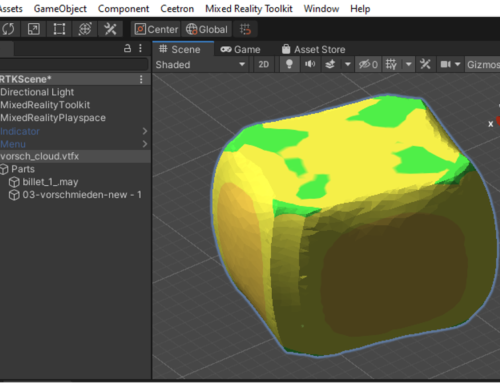
In a better world: Reports in electronic formats allow a whole spectrum of advanced information to be contained within them. In a simulation report, full 3D models and results would be obvious extensions. Open XML-based formats such as ODF and OOXML would provide software developers with a mechanism to embed 3D information directly into reports. This would enable the recipient to explore the model in full 3D, providing increased understanding and more data readily available. This could significantly reduce the need for multiple images (and videos), adding flexibility and the ability to answer ad-hoc questions.
The future of the engineering reporting work flows
Some think that by 2020, the technical memo will be gone. They say we’ll all be collaborating directly on data in the SPDM system, possibly supplemented with some ppts. At Ceetron, we beg to differ.
A number of major US technology companies are going the other way, mandating the internal memo as the preferred communication tool. After banning PowerPoint, Jeff Bezos, CEO of Amazon, said: “The reason writing a good 4 page memo is harder than ‘writing’ a 20 page powerpoint is because the narrative structure of a good memo forces better thought and better understanding of what’s more important than what, and how things are related.” The New York Times had an interesting story some time ago on how military commanders in the US Armed Forces ban the use of ppts and advocate the use of the memo. http://www.nytimes.com/2010/04/27/world/27powerpoint.html
That said, we also observe a trend towards online/cloud-based reports, where one gets away from the desktop formats and into platform-independent HTML-based reports. Written/prepared in Google Docs, MS Office or any editor, yes, but the presentation will be cloud-based and integrated with the data.
In conclusion, we believe engineering reporting in 2020-2030 will be a lot like it is today: document-centric, visualization-centric, and collaboration-centric. We also believe that there is a need for, sometimes including legal reasons for, creating a non-editable final version of a document, with no interactivity, but possible the ability to add comments or notes and access the model in read mode through hyperlinks and in a browser. Let us call it pdf with plug in-free in-browser visualization of CAE models. At the same time there will be an SPDM system for storing and archiving data, and various editable document formats, probably including something similar to Word, PowerPoint, or Google Docs. And, there will be asynchronous collaboration tools, engineering-specific or general like Sharepoint and Evernote, for supporting collaboration-centric workflows. Finally, one could envisage the emergence of ISO / NAFEMS standards for the field of technical reporting.
Several CAE software vendors have over the years released packages with report generation features integrated. However, it seems that few, if any, have had a significant take-up in the market. (This applies also to GLview ReportBuilder, Ceetron’s second generation end user product for reporting.)
We believe that our recent release of Ceetron Report may change that. At least we have tried to address five key challenges outlined above, and looked into the crystal ball to see where engineering reporting may go in the future. While we cannot say we have the perfect solution, we think it will be a good starting point for the solid reporting work horse that the CAE community requires.
Thanks to Jan Christian Anker for his contributions to this article and for improving my understanding of how reporting really works in engineering organizations. Needless to say, all opinions, errors, misunderstandings, and omissions are my own.
Tor Helge Hansen
CEO, Ceetron
* Jan Christian was a board member of Ceetron before its restructuring in 2014 through an MBO. He is an Oslo-based independent consultant in mechanical engineering, simulation, and patenting. The founder of Anker-Zemer Engineering and co-founder of TechNet Alliance, he has also previously held senior engineering positions with Control Data Corporation, Daimler Benz, and Universitaet Karlruhe / Deutsche Forschungsgemeinscaft. He earned a Dipl. Ing. degree in Mechanical Engineering from Universitaet Karlruhe.


Leave A Comment
You must be logged in to post a comment.